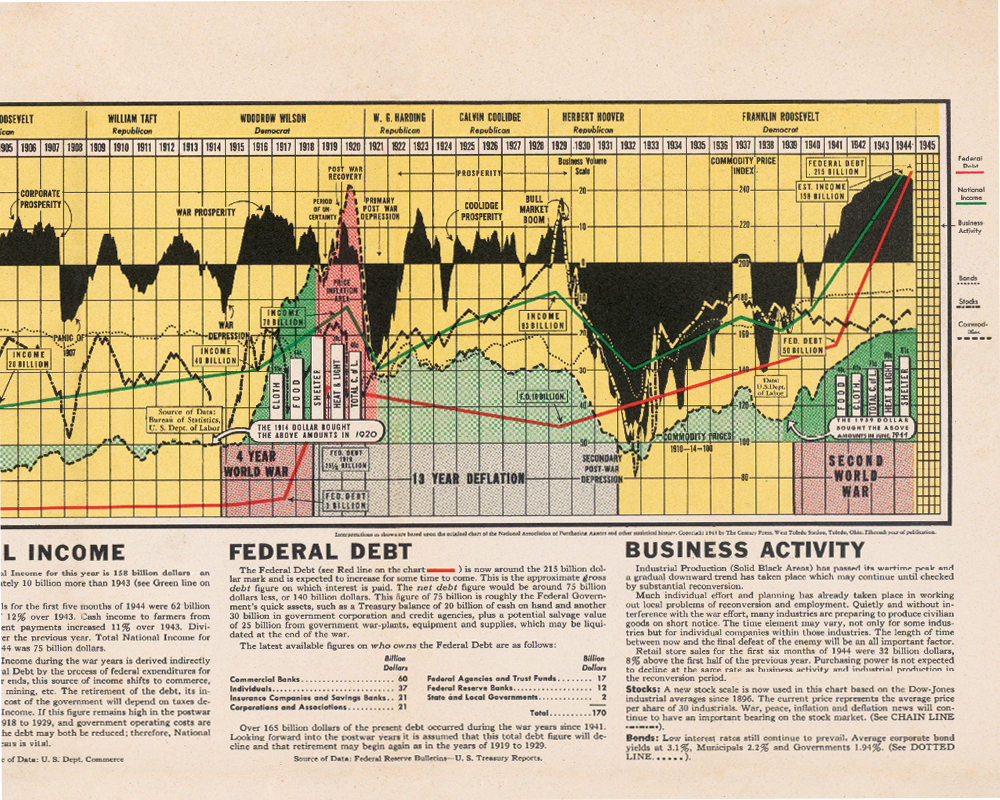
Business Booms
In a single chart, Business Booms and Depressions Since 1775, provides a sweeping and detailed financial visual history of the United States. It covers inflation and deflation, price trends, national income, Federal debt, and business activity. At the core is a giant wave depicting the ebb and flow of the national prosperity. The cycles of booms and depressions are fascinating to trace across time and presidential administrations. This classic financial data visualization covers the time period from 1775 to 1944 has been carefully restored from a high-resolution scan of the original chart.
This reproduction print was crafted from an original map created in 1945. The original was scanned on a large-format, flatbed, high-resolution scanner and meticulously restored by hand. The map is printed on professional-grade matte paper using vivid, archival inks. It is carefully hand-rolled in tissue paper or plastic sleeves and mailed in heavy-duty tubes or boxes.


